Resource Library
Guides. Briefs. Toolkits. Quick reference information. IDC and its partners created these data quality resources to help states better prepare to address their existing or emerging IDEA data quality needs. Use our search and filtering tools to navigate the library.
Resources 1 - 7 of 9
Format: Guides and Briefs
Parent Involvement Data: How to Measure and Improve Representativeness for Indicator B8This interactive resource provides states with an overview on how to gather representative parent involvement data for Part B SPP/APR Indicator 8. The resource defines key concepts such as representativeness, sampling, nonresponse bias, response rates, and weighting. It also offers information on how to improve the quality of parent involvement data, including strategies that can help states collect representative data and evaluate and improve the representativeness of their data before, during, and after data collection.
Format: Quick Reference
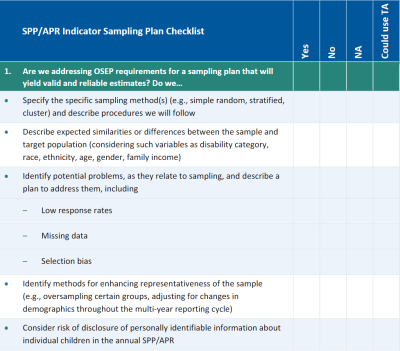
SPP/APR Indicator Sampling Plan ChecklistStates are allowed to use sampling for collecting data for select Part B State Performance Plan/Annual Performance Report indicators. Sampling can provide an effective means for targeting resources for data collection and improving data quality. However, there are important requirements that states must consider when designing and implementing their sampling plans. States can use this interactive self-assessment tool to determine whether their state’s sampling plan addresses Office of Special Education Programs sampling requirements for best practice and to identify action steps to improve their sampling procedures.
Format: Applications and Spreadsheets
Nonresponse Bias Analysis ApplicationThe NRBA App is an interactive nonresponse bias application powered by state-of-the-art statistical software. We developed this application to help states examine their SPP/APR Indicator 8 and Indicator 14 data through nonresponse bias analysis. The NRBA App allows users to conduct reproducible analyses of response rates, representativeness, and nonresponse bias, tailored to their survey’s data collection method.
Format: Quick Reference
SPP/APR Indicator CardThe SPP/APR indicators measure child and family outcomes as well as compliance with the requirements of IDEA. This quick-reference resource from IDC includes a list and brief definition of all the Part B FFY 2020–2025 SPP/APR indicators (including the new Indicator 18!), as well as a list of file specifications associated with each of the seven IDEA 618 data collections, all in one convenient package. Print one out here or contact your IDC State Liaison for a laminated version you can carry along wherever you go.
Format: Guides and Briefs
The Assessment Data Journey: Are We There Yet?Data for Part B Indicator 3 follow a long and complicated process that begins when a student is registered as a test taker in a state assessment system and ends with public reporting via the SPP/APR. Multiple factors are involved in this process, and regular and ongoing communication and collaboration among the various people involved can make this process easier. This suite of four resources can help states with the work. The interactive infographic provides general information about the process for a typical state.
Format: Guides and Briefs
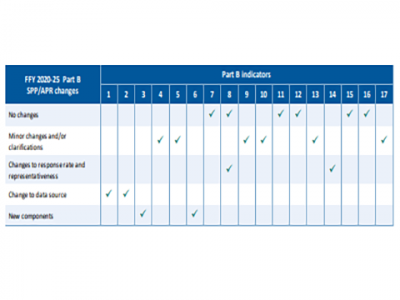
FFY 2020–25 Part B SPP/APR Changes at a GlanceThe FFY 2020–25 Part B SPP/APR Changes at a Glance resource is a quick overview for tracking updates to indicators in the new FFY 2020–25 SPP/APR package. For each of the 17 SPP/APR indicators, the table denotes whether there will be no changes, minor changes and/or clarifications, changes to response rates and representativeness, changes to data sources, and new components.
Format: Guides and Briefs
Statewide Assessment: Indicator 3 Measurement Changes From FFY 2019 to FFY 2020–2025This resource offers a side-by-side comparison of the SPP/APR Part B indicator measurement tables for FFY 2019 and FFY 2020 to highlight new SPP/APR reporting requirements and measurement changes to Indicator 3. The majority of students with disabilities participate in regular statewide assessments, and a small percentage of students with the most significant disabilities participate in alternate assessments. In FFY 2020, OSEP requires states to disaggregate statewide assessment results for these two groups of students with disabilities (i.e., those who participate in the regular assessment and those who participate in the alternate assessment). OSEP also requires states to calculate a “proficiency rate gap” between students with and without disabilities who participate in the regular statewide assessment.


