Site Search
Results 1 - 7 of 13
Format: Guides, Papers, and Reports
Part B State Performance Plan/Annual Performance Report 2019 Indicator AnalysesThe Part B State Performance Plan/Annual Performance Report 2019 Indicator Analyses presents a national quantitative picture of the implementation of Part B of IDEA based on a review of information 60 states and jurisdictions reported in the FFY 2017 APRs and amended SPPs they submitted to OSEP in spring 2019.
Format: Online Applications
The Uses and Limits of Data: Supporting Data Quality With a Strong Data ChainThis online learning module provides a general overview of how the methods and design of data collection and analysis affect interpretation of the data. The module presents the different links in the data chain (e.g., defining the question, measurement strategy) and describes how each link contributes to quality of data and data analyses. The module also includes examples from a selection of Part B and Part C SPP/APR indicators to illustrate how each step in the data chain contributes to the integrity of the data and its interpretation
Format: Recordings
Part B State Performance Plan/Annual Performance Report 2016 Indicator AnalysesThe Part B State Performance Plan/Annual Performance Report 2016 Indicator Analyses presents a national picture of the implementation of IDEA based on a review of information 60 states and jurisdictions reported in their FFY 2014 APRs and amended SPPs that they subsubmitted to OSEP in spring of 2016.
Format: Guides, Papers, and Reports
Part B State Performance Plan/Annual Performance Report 2015 Indicator AnalysesThe 2015 SPP/APR Indicator Analyses for Part B presents a national quantitative picture of the implementation of Part B of IDEA based on a review of information 60 states and jurisdictions reported in their FFY 2013 Annual APRs. For the purposes of the report, the term “state” is used for both states and territories. The report, which covers Part B Indicators 1 through 17, can be downloaded in Word format.
Format: Applications and Spreadsheets
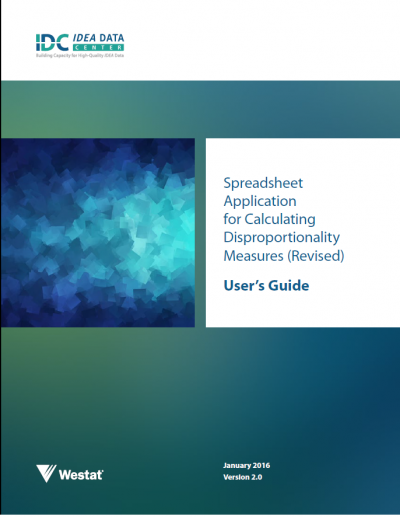
Spreadsheet Application for Calculating Disproportionality Measures and User’s Guide: Spreadsheet Application for Calculating Disproportionality Measures (Revised)States can use the Excel spreadsheet application for calculating disproportionality measures and accompanying user's guide in their assessment of racial/ethnic disproportionality. The spreadsheet application calculates several disproportionality measures and the User’s Guide provides instructions for using the spreadsheet application.
Please note this resource is currently not 508 accessible. If you need assistance with the use of this resource, please contact us at www.ideadata.org.
Format: Guides, Papers, and Reports
Equity, Inclusion, and Opportunity: Addressing Success Gaps, White PaperThis white paper focuses on elements of equity, inclusion, and opportunity that can minimize or eliminate success gaps among different groups of students. It provides the research-based background that guided development of a complementary rubric that schools or districts can use to systematically examine the root causes of success gaps among groups of their students. The white paper has been updated recently and now includes considerations for children as young as preschool.
Format: Presentations
Using State Data to Inform Parent Center WorkThe purpose of this presentation was to introduce PTI and CPRC directors and staff to the IDEA data collected and reported by state education agencies and discuss how these data can be used to inform many of the fourteen priority topics for the PTI/CPRC network. These priorities were identified in the most recent OSEP requests for proposals for PTI and CPRC funding.

