Site Search
Results 8 - 14 of 36
-
Improving Indicator 6 Data Quality to Reflect Inclusive Practices
IDC and staff from the state of Washington held a discussion on improving Indicator 6 data quality. IDC provided an overview of 618 Child Count and Educational Environments data and Indicator 6. Washington state staff described the coaching they provided to regional and district staff to help them better understand, improve, and use Indicator 6 data to promote more inclusive educational environments for preschoolers with disabilities. These efforts have created changes at both the system and district levels.
-
Including Results Data in General Supervision Systems
This IDEA Data Center (IDC) and National Center for Systemic Improvement (NCSI) joint webinar focused on learning from states that are working to meaningfully include student results or outcomes data in their general supervision systems. Presenters shared “lessons learned” from state work, including both important considerations for states that are in the planning stages, as well as for those actively engaged in centering results data in their accountability and support systems. Participants also heard how states can integrate data use as part of their general supervision system.
-
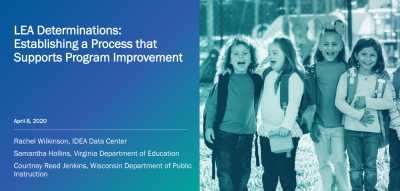
LEA Determinations: Establishing a Process That Supports Program Improvement
During this IDC webinar, participants learned about federal requirements for LEA determinations of performance. They also learned about national trends for issuing LEA determinations, including information on the data elements and calculation methodologies states use in making their LEA determinations. Additionally, two states shared their current LEA determination processes and the impact of these processes on local special education programs.
-
Leadership with an Equity Mindset: Using Preschool Special Education Data
ECTA + IDC + DaSy? Yes! Join us on April 26 for the first in this four-part webinar series on preschool special education data in which we will cover bringing an equity mindset to the full data life cycle. This series will prepare you to identify and analyze your data to remove barriers to equitable access, experiences, and outcomes as part of a continuous improvement process.
-
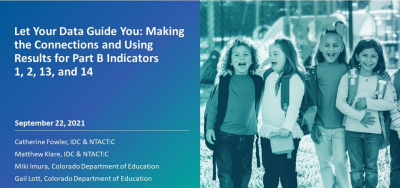
Let Your Data Guide You: Making Connections and Using Results From Part B Indicators 1, 2, 13, and 14
Staff from IDC and the (NTACT:C) shared resources and discussed how they support states with Part B Indicators 1, 2, 13, and 14. State co-presenters discussed how partnerships between data and program staff enhance the state’s work on these indicators. State staff shared strategies and lessons learned for translating high-quality data into effective data use to identify trends, support target setting, and select appropriate evidence-based practices as well as discussed how reviewing the results of these related indicators as a group can help improve understanding of the system and drive next steps.
-
Low Preschool Inclusion Rates: A Problem of Practice or Bad Data?
SPP/APR Indicator 6A data have not budged in decades. Is it true that there hasn’t been progress on inclusion for preschoolers with disabilities or are data quality issues preventing us from seeing progress? Join us to explore solutions to promote high-quality preschool inclusion practices and methods to improve data quality for indicator 6A. We will dig deeper to understand the relationship between inclusion, placement practices, and quality data collection.


