Resource Library
Guides. Briefs. Toolkits. Quick reference information. IDC and its partners created these data quality resources to help states better prepare to address their existing or emerging IDEA data quality needs. Use our search and filtering tools to navigate the library.
Resources 50 - 56 of 88
Format: Applications and Spreadsheets
Data Sources for Calculating Significant DisproportionalityData Sources for Calculating Significant Disproportionality provides a summary of the data needed to calculate significant disproportionality for identification, placement, and discipline. For each category of analysis, this resource provides a description of the data needed to calculate the risk numerator and risk denominator, and notes the relevant EDFacts file specifications, including which subtotals or category sets, as appropriate.
Format: Applications and Spreadsheets
IDEA Part B Data Manager CompetenciesThe IDEA Part B Data Manager Competencies tool outlines foundational knowledge and skills necessary for typical data manager roles and responsibilities. The competencies reflect principles for effective management, support, and use of high-quality IDEA Part B data and fall under one of three overarching categories: content knowledge and skills, technical knowledge and skills, and interpersonal skills.
Format: Guides and Briefs
2020 Part B FFY 2018 SPP/APR Indicator Analysis BookletThe 2020 Part B FFY 2018 SPP/APR Indicator Analysis Booklet presents a national quantitative picture of the implementation of Part B of IDEA based on a review of information 60 states and agencies (i.e., the 50 states, commonwealths, territories, and the Bureau of Indian Education) reported in the FFY 2018 APRs and amended SPPs they submitted to OSEP in spring 2020. For the purposes of the report, the term “state” is used for both states and other jurisdictions. The report covers Part B Indicators 1 through 17.
Format: Guides and Briefs
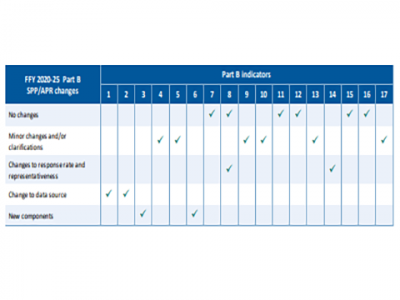
FFY 2020–25 Part B SPP/APR Changes at a GlanceThe FFY 2020–25 Part B SPP/APR Changes at a Glance resource is a quick overview for tracking updates to indicators in the new FFY 2020–25 SPP/APR package. For each of the 17 SPP/APR indicators, the table denotes whether there will be no changes, minor changes and/or clarifications, changes to response rates and representativeness, changes to data sources, and new components.
Format: Applications and Spreadsheets
618 Data Collection CalendarWho doesn't love a good calendar? This tool serves as a reference for states as they plan for the timely and accurate submission of their 618 data collections. Simply select a month to view the data collection and corresponding tasks and activities for that month, or select a report to view a monthly breakdown of activities and related resources.
Format: Quick Reference
Templates for Part B SPP/APR Stakeholder Involvement and Target SettingStates can use the Organizer Template for Part B SPP/APR Target Setting to briefly document information for consideration when setting new SPP/APR targets for all indicators in the FFYs 2020–25 SPP/APR collection. States can supplement this overview template with the Indicator Organizer for Part B SPP/APR Stakeholder Involvement and Target Setting, which is designed to capture more detailed information on stakeholder involvement in setting targets for individual SPP/APR indicators.
Format: Quick Reference
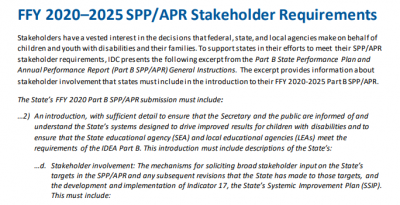
FFY 2020-2025 SPP/APR Stakeholder RequirementsThe FFY 2020-2025 SPP/APR shares the stakeholder requirements for the FFY 2020-2025 SPP/APR in a simple one page format. This resource can be used with state staff and other partners when planning for the SPP/APR.


