Resource Library
Guides. Briefs. Toolkits. Quick reference information. IDC and its partners created these data quality resources to help states better prepare to address their existing or emerging IDEA data quality needs. Use our search and filtering tools to navigate the library.
Resources 1 - 6 of 6
Format: Guides and Briefs
Examining Representation and Identification: Over, Under, or Both?Significant disproportionality with regard to identifying children as children with disabilities or as children with specific disabilities is, by definition, overrepresentation. This resource defines overrepresentation and three related terms: over-identification, under-identification, and underrepresentation. States can use this resource, in conjunction with the Success Gaps Toolkit to help identify and address the factors contributing to significant disproportionality (i.e., overrepresentation) within school districts.
Format: Quick Reference
618 Data Collection and Submission TimelineA graphic illustrating how different IDEA data collections can span multiple years and how a state may be working simultaneously with data from multiple school years.
Format: Applications and Spreadsheets
618 Data Collection CalendarWho doesn't love a good calendar? This tool serves as a reference for states as they plan for the timely and accurate submission of their 618 data collections. Simply select a month to view the data collection and corresponding tasks and activities for that month, or select a report to view a monthly breakdown of activities and related resources.
Format: Applications and Spreadsheets
SEA Edit Check and Data Display Tools for IDEA 618 Part B DataIDC presents the SEA Edit Check and Data Display Tools for IDEA 618 Part B Data to help states prepare their Part B data submissions. States can use these tools to review the contents of their IDEA 618 EDFacts Part B personnel, exiting, discipline and child count and educational environment data for children ages 3–5 (FS089) and students ages 6–21 (FS002) prior to submission to the EDFacts Submission System or ESS. The tools apply edit checks and identify potential errors in subtotals or totals in the data files. In addition, the tools provide user-friendly summaries of the 618 data. The tools are enhanced versions of the SEA Edit Check and Data Display Tools for personnel, exiting, discipline, and child count and educational environment data. The main difference is the enhanced edit check tools require states to directly copy and paste the EDFacts data files they will submit to ESS as opposed to manually entering data into an Excel file in a format that is different than the one required for submission to ESS.
Format: Guides and Briefs
Success Gaps Rubric: Addressing Equity, Inclusion, and OpportunityThis rubric allows a team of users from a district or school to systematically examine the root causes of success gaps among groups of students by focusing on equity, inclusion, and opportunity. The recently updated rubric now includes considerations for children as young as preschool age. A complementary white paper provided the research-based background that supported development of the rubric.
Format: Toolkits
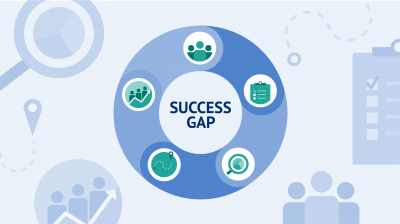
Success Gaps Toolkit: Addressing Equity, Inclusion, and OpportunityThe Success Gaps Toolkit presents a process for using data and the Success Gap Rubric to identify root causes of gaps between groups of children in districts or schools. These success gaps occur when the education system is not meeting the needs of all groups of children and outcomes for some groups are different than outcomes for most groups. The toolkit, with its process and materials, provides a manageable and defined way for districts or schools to identify success gaps that are present and their root causes and then make a plan for addressing the gaps. The success gaps may be the graduation rate of students who are English learners compared to the rate of all other children, the out-of-school suspension rate of children who are Black compared to the rate of all other children, the identification of children who are Hispanic as children with specific learning disabilities compared to the identification of all other children, and other gaps.


