Site Search
Results 1 - 7 of 8
Format: Guides and Briefs
IDEA Section 618 Public Reporting Data Element Checklist – Part BThis interactive checklist helps states meet IDEA Section 618 public reporting requirements. The checklist also has an archiving function to document the posting process for later reference.
Format: Presentations
Public Reporting of Section 618 Data: Regulations, Processes, and PitfallsIDEA requires that states publicly report Section 618 data. To assist SEA special education directors and data managers in meeting these requirements, IDC is developing a TA tool to simplify regulatory language and requirements into one document that includes process tips and pitfalls. The presentation highlighted existing practice across the country and provided opportunity for attendees to review the current draft of the proposed TA tool.
Format: Presentations
Visualizing IDEA DataIDC staff provided an introduction to data visualization approaches that are particularly useful for presenting IDEA data for the public. Participants learned simple strategies, chart types, and report styles that can be used to visualize the state’s data using Microsoft Excel, PowerPoint, and free online tools. Presenters also provided a set of activities so participants can continue developing their capacity in follow-up to the interactive institute.
Format: Presentations
Increasing Your State’s Capacity to Share Your Data EffectivelyIn this workshop, states set the stage by telling a story of how they engage stakeholders using data visualization techniques for effective communication. Session presenters introduced the IDC Part B Indicator Data Display Wizard to help states create data displays quickly and easily using SPP/APR data. In an interactive activity, participants discussed their current experiences with data use and communication and how the IDC Part B Indicator Data Display Wizard can help them create or improve a state’s current data visualization and communication process.
Format: Applications and Spreadsheets
Interactive Public Reporting EngineThe Interactive Public Reporting Engine displays the complete set of IDEA data that states collect and submit to OSEP to meet the requirements of Section 618 of IDEA. This tool displays each dataset and the required disaggregations such as race/ethnicity, gender, and age. It provides a more dynamic way for states to meet the 618 public reporting requirements, and linking to the tool fulfills the public reporting requirements. In addition, use of the tool promotes conversations about how to improve results among families, teachers, schools, related service providers, administrators, policymakers, and other interested stakeholders.
Format: Toolkits
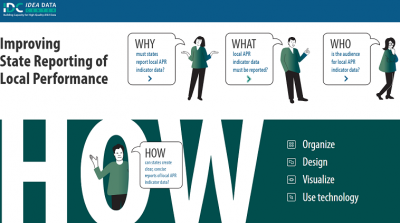
Why, What, Who, and HOW: Improving State Reporting of Local PerformanceThis toolkit provides an overview of the public reporting requirements in IDEA Section 616 and provides suggestions to present local performance in easy-to-understand formats. SEAs and Part C lead agencies (LAs) must report on the annual performance of their LEAs and early childhood local programs on the targets in the SPP. The toolkit includes the Section 616 legislation and provides information about the why, what, who, and how of state reporting of local performance data.
Format: Applications and Spreadsheets
Part B Indicator Data Display WizardThe IDC Part B Indicator Data Display Wizard helps state education agency (SEA) staff communicate complex data to stakeholders in a more user-friendly manner. This tool is designed to create data visualizations, in the form of charts, based on State Performance Plan/Annual Performance Report (SPP/APR) data the user enters. IDC has updated the tool to make it easier for users to create visualizations based on the charts’ purposes. Many of the visualizations are dynamic and automatically update based on the data the user enters into the tool. States can easily transfer the visualizations to other programs to meet their reporting needs based on the audience, message, and purpose of the desired report or presentation they are preparing.


