Site Search
Results 22 - 28 of 67
Format: Presentations
Collecting High-Quality Data: Why It Is ImportantThis presentation focused on what is meant by the term “data quality” and provided information regarding the importance of high-quality data in the collection, reporting, and use of data in local and state decision making. Presenters shared actual examples from state experiences.
Format: Presentations
Collecting Quality Data: Why It Matters and Guidance to Improve Our ProcessThis presentation provided information that would allow participants to increase their knowledge of what constitutes high-quality data, how to improve processes for collecting high-quality data, and the use of high-quality data for measuring program effectiveness.
Format: Presentations
Data Mining Section 618 Data to Prepare the APRThe required measurements for APR Indicators B3, B4, B5, B6, B9, and B10 (the assessment, discipline, LRE, and disproportionality indicators) are based on Section 618 data. This session focused on selected section 618 data submissions and how the data can be explored to provide more in-depth information for use in discussion with state’s APR stakeholders. Presenters demonstrated some practical methods for taking a deeper look at data in the IDEA EDFacts file submissions using readily available data analysis tools (Microsoft Excel).
Format: Toolkits and Templates
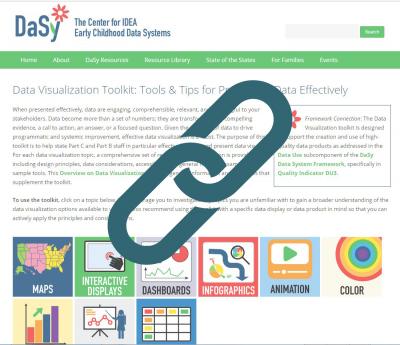
Data Visualization Toolkit: Tools & Tips for Presenting Data EffectivelyThe purpose of the toolkit is to help state Part C and Part B staff effectively create and use engaging data displays. For each data visualization topic, the toolkit presents a comprehensive set of resources and information, including design principles, data considerations, accessibility tips, general how-to’s, examples, and sample tools. DaSy and NCSI partnered to create the toolkit.
Format: Toolkits and Templates
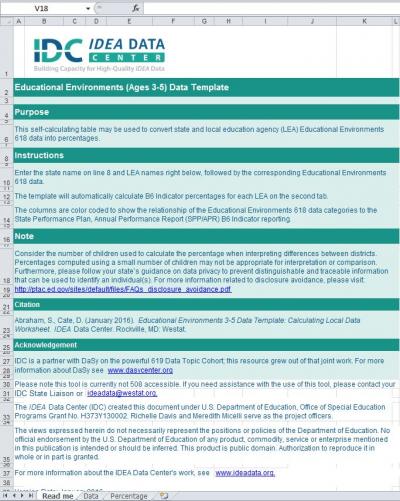
Educational Environments 3-5 Data Template: Calculating Local Data WorksheetThis data template provides SEAs and LEAs the opportunity to see in real-time the percentages of their children ages 3-5 attending and receiving services in specific educational environments. When the LEA 618 educational environments data is simply entered on the data tab, the percentages will be calculated and displayed on the percentage tab. The use of this tool will allow SEAs to compare the percentages of children within educational environments across LEAs.
Format: Recordings
EMAPS IDEA Part C Child Count and Settings Survey WebinarOn Tuesday, February 23, 2016, OSEP, ESB, and PSC presented the EMAPS IDEA Part C Child Count and Settings Survey Webinar.
The purpose of this webinar was to review the procedures for submitting this survey, including the new cumulative counts for race/ethnicity and gender, new additional year-to-year rows, and change in the email notifications. The final slides are available to review here: https://edfacts.grads360.org/#communities/pdc/documents/10065


