Site Search
Results 295 - 301 of 608
Format: Presentations
Building a Culture of High-Quality Part B Data – Tennessee and WashingtonThis session highlighted Tennessee and Washington as presenters and told their states' stories of how they have created a culture of high-quality data.
Format: Presentations
OSEP UpdatesThis session featured updates from OSEP on topics such as the 2019 budget, Education Department strategic plan, Endrew F. v. Douglas County School District, Results Driven Accountability, and other topics of interest.
Format: Presentations
Supporting Dropout/Graduation As a Part B SiMRThe presentation provides strategies to support the Coherent Improvement Strategies in states' Phase I Part B SSIPs and highlights graduation/transition SIMRs.
Format: Toolkits
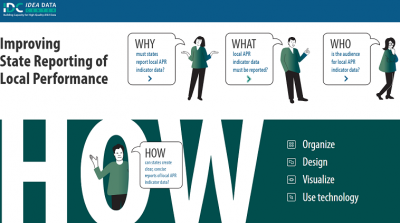
Why, What, Who, and HOW: Improving State Reporting of Local PerformanceThis toolkit provides an overview of the public reporting requirements in IDEA Section 616 and provides suggestions to present local performance in easy-to-understand formats. SEAs and Part C lead agencies (LAs) must report on the annual performance of their LEAs and early childhood local programs on the targets in the SPP. The toolkit includes the Section 616 legislation and provides information about the why, what, who, and how of state reporting of local performance data.
Format: Applications and Spreadsheets
Part B Indicator Data Display WizardThe IDC Part B Indicator Data Display Wizard helps state education agency (SEA) staff communicate complex data to stakeholders in a more user-friendly manner. This tool is designed to create data visualizations, in the form of charts, based on State Performance Plan/Annual Performance Report (SPP/APR) data the user enters. IDC has updated the tool to make it easier for users to create visualizations based on the charts’ purposes. Many of the visualizations are dynamic and automatically update based on the data the user enters into the tool. States can easily transfer the visualizations to other programs to meet their reporting needs based on the audience, message, and purpose of the desired report or presentation they are preparing.
Format: Reference Materials
ii18 Agenda with LinksThis pdf of the final ii18 agenda includes links to the presentation and handouts on the website
Format: Presentations
Leveraging Internal Resources and Working Across Systems to Achieve SIMRsThe presentation provides an overview of how states have improved results for infants, toddlers, and students through coordinated processes and planning at the state and local levels. Strategies include leveraging resources, considering related initiatives to support the SIMR, and communication protocols.


